


Congressional District 5, Oregon
About
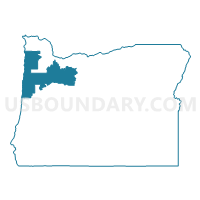
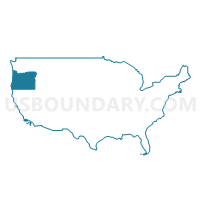
Outline

Summary
| Unique Area Identifier | 118723 |
| Name | Congressional District 5 |
| State | Oregon |
| Area (square miles) | 5,829.90 |
| Land Area (square miles) | 5,363.65 |
| Water Area (square miles) | 466.24 |
| % of Land Area | 92.00 |
| % of Water Area | 8.00 |
| Latitude of the Internal Point | 45.01728440 |
| Longtitude of the Internal Point | -123.16939930 |
| Total Population | 757,128 |
| Total Housing Units | 323,695 |
| Total Households | 288,504 |
| Median Age | 38.3 |
Maps
Graphs
Select a template below for downloading or customizing gragh for Congressional District 5, Oregon


Neighbors
Neighoring 111th Congressional District (by Name) Neighboring 111th Congressional District on the Map
- Congressional District 1, OR
- Congressional District 2, OR
- Congressional District 3, OR
- Congressional District 4, OR
Top 10 Neighboring County (by Population) Neighboring County on the Map
- Multnomah County, OR (735,334)
- Washington County, OR (529,710)
- Clackamas County, OR (375,992)
- Lane County, OR (351,715)
- Marion County, OR (315,335)
- Linn County, OR (116,672)
- Yamhill County, OR (99,193)
- Benton County, OR (85,579)
- Polk County, OR (75,403)
- Columbia County, OR (49,351)
Top 10 Neighboring County Subdivision (by Population) Neighboring County Subdivision on the Map
- Portland East CCD, Multnomah County, OR (462,994)
- Beaverton-Hillsboro CCD, Washington County, OR (404,973)
- Northwest Clackamas CCD, Clackamas County, OR (248,731)
- Salem CCD, Marion County, OR (224,401)
- Portland West CCD, Multnomah County, OR (125,084)
- Corvallis CCD, Benton County, OR (65,959)
- Albany CCD, Linn County, OR (52,612)
- Newberg CCD, Yamhill County, OR (37,156)
- Woodburn CCD, Marion County, OR (30,562)
- Salem CCD, Polk County, OR (28,737)
Top 10 Neighboring Place (by Population) Neighboring Place on the Map
- Portland city, OR (583,776)
- Salem city, OR (154,637)
- Corvallis city, OR (54,462)
- Albany city, OR (50,158)
- Tigard city, OR (48,035)
- Lake Oswego city, OR (36,619)
- Keizer city, OR (36,478)
- Oregon City city, OR (31,859)
- Tualatin city, OR (26,054)
- West Linn city, OR (25,109)
Top 10 Neighboring Unified School District (by Population) Neighboring Unified School District on the Map
- Portland School District 1J, OR (459,982)
- Beaverton School District 48J, OR (255,082)
- Salem-Keizer School District 24J, OR (242,521)
- North Clackamas School District 12, OR (113,237)
- Tigard-Tualatin School District 23J, OR (78,274)
- Corvallis School District 509J, OR (65,449)
- Greater Albany School District 8J, OR (60,802)
- Oregon City School District 62, OR (54,748)
- Lincoln County School District, OR (46,192)
- West Linn School District 3J, OR (45,262)
Top 10 Neighboring State Legislative District Lower Chamber (by Population) Neighboring State Legislative District Lower Chamber on the Map
- State House District 26, OR (76,186)
- State House District 15, OR (67,333)
- State House District 20, OR (66,979)
- State House District 19, OR (66,172)
- State House District 24, OR (66,002)
- State House District 35, OR (65,721)
- State House District 39, OR (65,719)
- State House District 25, OR (65,088)
- State House District 37, OR (63,742)
- State House District 36, OR (63,722)
Top 10 Neighboring State Legislative District Upper Chamber (by Population) Neighboring State Legislative District Upper Chamber on the Map
- State Senate District 13, OR (141,274)
- State Senate District 10, OR (133,151)
- State Senate District 8, OR (130,092)
- State Senate District 18, OR (129,443)
- State Senate District 12, OR (128,429)
- State Senate District 26, OR (126,141)
- State Senate District 14, OR (126,140)
- State Senate District 20, OR (125,136)
- State Senate District 11, OR (125,061)
- State Senate District 9, OR (123,674)
Top 10 Neighboring Census Tract (by Population) Neighboring Census Tract on the Map
- Census Tract 321.03, Washington County, OR (10,190)
- Census Tract 203.02, Polk County, OR (9,647)
- Census Tract 303.01, Yamhill County, OR (9,628)
- Census Tract 16.02, Marion County, OR (9,286)
- Census Tract 20, Marion County, OR (9,208)
- Census Tract 52.02, Polk County, OR (9,136)
- Census Tract 201, Linn County, OR (9,124)
- Census Tract 103.06, Marion County, OR (9,060)
- Census Tract 25.01, Marion County, OR (8,868)
- Census Tract 52.01, Polk County, OR (8,827)
Top 10 Neighboring 5-Digit ZIP Code Tabulation Area (by Population) Neighboring 5-Digit ZIP Code Tabulation Area on the Map
- 97301, OR (53,518)
- 97045, OR (51,359)
- 97223, OR (46,699)
- 97330, OR (41,472)
- 97305, OR (40,176)
- 97202, OR (38,762)
- 97219, OR (38,709)
- 97303, OR (38,663)
- 97302, OR (37,131)
- 97222, OR (34,979)
Data
Demographic, Population, Households, and Housing Units
** Data sources from census 2010 **
Show Data on Map
Download Full List as CSV
Download Quick Sheet as CSV
| Subject | This Area | Oregon | National |
|---|---|---|---|
| POPULATION | |||
| Total Population Map | 757,128 | 3,831,074 | 308,745,538 |
| POPULATION, HISPANIC OR LATINO ORIGIN | |||
| Not Hispanic or Latino Map | 644,649 | 3,381,012 | 258,267,944 |
| Hispanic or Latino Map | 112,479 | 450,062 | 50,477,594 |
| POPULATION, RACE | |||
| White alone Map | 637,329 | 3,204,614 | 223,553,265 |
| Black or African American alone Map | 6,683 | 69,206 | 38,929,319 |
| American Indian and Alaska Native alone Map | 10,502 | 53,203 | 2,932,248 |
| Asian alone Map | 17,977 | 141,263 | 14,674,252 |
| Native Hawaiian and Other Pacific Islander alone Map | 3,337 | 13,404 | 540,013 |
| Some Other Race alone Map | 54,484 | 204,625 | 19,107,368 |
| Two or More Races Map | 26,816 | 144,759 | 9,009,073 |
| POPULATION, SEX | |||
| Male Map | 373,651 | 1,896,002 | 151,781,326 |
| Female Map | 383,477 | 1,935,072 | 156,964,212 |
| POPULATION, AGE (18 YEARS) | |||
| 18 years and over Map | 576,866 | 2,964,621 | 234,564,071 |
| Under 18 years | 180,262 | 866,453 | 74,181,467 |
| POPULATION, AGE | |||
| Under 5 years | 47,755 | 237,556 | 20,201,362 |
| 5 to 9 years | 49,192 | 237,214 | 20,348,657 |
| 10 to 14 years | 51,458 | 242,553 | 20,677,194 |
| 15 to 17 years | 31,857 | 149,130 | 12,954,254 |
| 18 and 19 years | 24,721 | 105,730 | 9,086,089 |
| 20 years | 11,478 | 52,462 | 4,519,129 |
| 21 years | 10,918 | 50,575 | 4,354,294 |
| 22 to 24 years | 29,316 | 150,011 | 12,712,576 |
| 25 to 29 years | 47,018 | 265,033 | 21,101,849 |
| 30 to 34 years | 45,828 | 259,111 | 19,962,099 |
| 35 to 39 years | 45,721 | 251,163 | 20,179,642 |
| 40 to 44 years | 47,465 | 248,362 | 20,890,964 |
| 45 to 49 years | 51,402 | 262,879 | 22,708,591 |
| 50 to 54 years | 54,695 | 276,196 | 22,298,125 |
| 55 to 59 years | 54,564 | 273,423 | 19,664,805 |
| 60 and 61 years | 20,084 | 100,551 | 7,113,727 |
| 62 to 64 years | 27,306 | 135,592 | 9,704,197 |
| 65 and 66 years | 14,781 | 73,650 | 5,319,902 |
| 67 to 69 years | 19,228 | 96,197 | 7,115,361 |
| 70 to 74 years | 23,750 | 120,194 | 9,278,166 |
| 75 to 79 years | 18,098 | 91,601 | 7,317,795 |
| 80 to 84 years | 14,720 | 74,019 | 5,743,327 |
| 85 years and over | 15,773 | 77,872 | 5,493,433 |
| MEDIAN AGE BY SEX | |||
| Both sexes Map | 38.30 | 38.40 | 37.20 |
| Male Map | 36.70 | 37.30 | 35.80 |
| Female Map | 39.70 | 39.50 | 38.50 |
| HOUSEHOLDS | |||
| Total Households Map | 288,504 | 1,518,938 | 116,716,292 |
| HOUSEHOLDS, HOUSEHOLD TYPE | |||
| Family households: Map | 192,189 | 963,467 | 77,538,296 |
| Husband-wife family Map | 148,733 | 733,741 | 56,510,377 |
| Other family: Map | 43,456 | 229,726 | 21,027,919 |
| Male householder, no wife present Map | 13,408 | 70,921 | 5,777,570 |
| Female householder, no husband present Map | 30,048 | 158,805 | 15,250,349 |
| Nonfamily households: Map | 96,315 | 555,471 | 39,177,996 |
| Householder living alone Map | 74,084 | 416,747 | 31,204,909 |
| Householder not living alone Map | 22,231 | 138,724 | 7,973,087 |
| HOUSEHOLDS, HISPANIC OR LATINO ORIGIN OF HOUSEHOLDER | |||
| Not Hispanic or Latino householder: Map | 262,783 | 1,409,055 | 103,254,926 |
| Hispanic or Latino householder: Map | 25,721 | 109,883 | 13,461,366 |
| HOUSEHOLDS, RACE OF HOUSEHOLDER | |||
| Householder who is White alone | 257,512 | 1,339,740 | 89,754,352 |
| Householder who is Black or African American alone | 1,976 | 24,638 | 14,129,983 |
| Householder who is American Indian and Alaska Native alone | 3,412 | 17,811 | 939,707 |
| Householder who is Asian alone | 5,667 | 45,466 | 4,632,164 |
| Householder who is Native Hawaiian and Other Pacific Islander alone | 828 | 3,647 | 143,932 |
| Householder who is Some Other Race alone | 12,682 | 50,154 | 4,916,427 |
| Householder who is Two or More Races | 6,427 | 37,482 | 2,199,727 |
| HOUSEHOLDS, HOUSEHOLD TYPE BY HOUSEHOLD SIZE | |||
| Family households: Map | 192,189 | 963,467 | 77,538,296 |
| 2-person household Map | 86,374 | 438,909 | 31,882,616 |
| 3-person household Map | 40,431 | 211,114 | 17,765,829 |
| 4-person household Map | 35,103 | 175,719 | 15,214,075 |
| 5-person household Map | 17,386 | 81,168 | 7,411,997 |
| 6-person household Map | 7,418 | 33,409 | 3,026,278 |
| 7-or-more-person household Map | 5,477 | 23,148 | 2,237,501 |
| Nonfamily households: Map | 96,315 | 555,471 | 39,177,996 |
| 1-person household Map | 74,084 | 416,747 | 31,204,909 |
| 2-person household Map | 17,545 | 109,435 | 6,360,012 |
| 3-person household Map | 2,849 | 18,159 | 992,156 |
| 4-person household Map | 1,108 | 7,031 | 411,171 |
| 5-person household Map | 464 | 2,621 | 126,634 |
| 6-person household Map | 156 | 920 | 48,421 |
| 7-or-more-person household Map | 109 | 558 | 34,693 |
| HOUSING UNITS | |||
| Total Housing Units Map | 323,695 | 1,675,562 | 131,704,730 |
| HOUSING UNITS, OCCUPANCY STATUS | |||
| Occupied Map | 288,504 | 1,518,938 | 116,716,292 |
| Vacant Map | 35,191 | 156,624 | 14,988,438 |
| HOUSING UNITS, OCCUPIED, TENURE | |||
| Owned with a mortgage or a loan Map | 135,982 | 678,120 | 52,979,430 |
| Owned free and clear Map | 50,636 | 266,365 | 23,006,644 |
| Renter occupied Map | 101,886 | 574,453 | 40,730,218 |
| HOUSING UNITS, VACANT, VACANCY STATUS | |||
| For rent Map | 7,818 | 40,193 | 4,137,567 |
| Rented, not occupied Map | 452 | 2,608 | 206,825 |
| For sale only Map | 4,922 | 24,191 | 1,896,796 |
| Sold, not occupied Map | 838 | 4,401 | 421,032 |
| For seasonal, recreational, or occasional use Map | 15,991 | 55,473 | 4,649,298 |
| For migrant workers Map | 33 | 461 | 24,161 |
| Other vacant Map | 5,137 | 29,297 | 3,652,759 |
| HOUSING UNITS, OCCUPIED, AVERAGE HOUSEHOLD SIZE BY TENURE | |||
| Total: Map | 2.55 | 2.47 | 2.58 |
| Owner occupied Map | 2.58 | 2.53 | 2.65 |
| Renter occupied Map | 2.49 | 2.36 | 2.44 |
| HOUSING UNITS, OCCUPIED, TENURE BY RACE OF HOUSEHOLDER | |||
| Owner occupied: Map | 186,618 | 944,485 | 75,986,074 |
| Householder who is White alone Map | 172,883 | 862,700 | 63,446,275 |
| Householder who is Black or African American alone Map | 723 | 8,106 | 6,261,464 |
| Householder who is American Indian and Alaska Native alone Map | 1,625 | 8,471 | 509,588 |
| Householder who is Asian alone Map | 3,405 | 28,280 | 2,688,861 |
| Householder who is Native Hawaiian and Other Pacific Islander alone Map | 225 | 1,196 | 61,911 |
| Householder who is Some Other Race alone Map | 4,766 | 18,640 | 1,975,817 |
| Householder who is Two or More Races Map | 2,991 | 17,092 | 1,042,158 |
| Renter occupied: Map | 101,886 | 574,453 | 40,730,218 |
| Householder who is White alone Map | 84,629 | 477,040 | 26,308,077 |
| Householder who is Black or African American alone Map | 1,253 | 16,532 | 7,868,519 |
| Householder who is American Indian and Alaska Native alone Map | 1,787 | 9,340 | 430,119 |
| Householder who is Asian alone Map | 2,262 | 17,186 | 1,943,303 |
| Householder who is Native Hawaiian and Other Pacific Islander alone Map | 603 | 2,451 | 82,021 |
| Householder who is Some Other Race alone Map | 7,916 | 31,514 | 2,940,610 |
| Householder who is Two or More Races Map | 3,436 | 20,390 | 1,157,569 |
| HOUSING UNITS, OCCUPIED, TENURE BY HISPANIC OR LATINO ORIGIN OF HOUSEHOLDER | |||
| Owner occupied: Map | 186,618 | 944,485 | 75,986,074 |
| Not Hispanic or Latino householder Map | 176,183 | 900,276 | 69,617,625 |
| Hispanic or Latino householder Map | 10,435 | 44,209 | 6,368,449 |
| Renter occupied: Map | 101,886 | 574,453 | 40,730,218 |
| Not Hispanic or Latino householder Map | 86,600 | 508,779 | 33,637,301 |
| Hispanic or Latino householder Map | 15,286 | 65,674 | 7,092,917 |
| HOUSING UNITS, OCCUPIED, TENURE BY HOUSEHOLD SIZE | |||
| Owner occupied: Map | 186,618 | 944,485 | 75,986,074 |
| 1-person household Map | 38,750 | 205,782 | 16,453,569 |
| 2-person household Map | 76,379 | 387,395 | 27,618,605 |
| 3-person household Map | 28,154 | 144,798 | 12,517,563 |
| 4-person household Map | 24,554 | 121,269 | 10,998,793 |
| 5-person household Map | 11,005 | 51,153 | 5,057,765 |
| 6-person household Map | 4,469 | 20,219 | 1,965,796 |
| 7-or-more-person household Map | 3,307 | 13,869 | 1,373,983 |
| Renter occupied: Map | 101,886 | 574,453 | 40,730,218 |
| 1-person household Map | 35,334 | 210,965 | 14,751,340 |
| 2-person household Map | 27,540 | 160,949 | 10,624,023 |
| 3-person household Map | 15,126 | 84,475 | 6,240,422 |
| 4-person household Map | 11,657 | 61,481 | 4,626,453 |
| 5-person household Map | 6,845 | 32,636 | 2,480,866 |
| 6-person household Map | 3,105 | 14,110 | 1,108,903 |
| 7-or-more-person household Map | 2,279 | 9,837 | 898,211 |
Loading...